
The Big PHAT Survey
So, after you’ve looked at 10, or maybe 1000 images, some of you may be wondering, “Just where did all this amazing data come from?”
Some Background: This project had its roots about 5 years ago, when the good folks who run the Hubble Space Telescope started wondering about the telescope’s legacy. Hubble is currently like a really great old car with a rebuilt engine — it does what it’s supposed to do really well, but you also wouldn’t be surprised if something went wrong. With this in mind, the question that arose was “If something were to happen to the Hubble, are there any important, lasting data sets that we wish we would have acquired?” And in particular, were there projects that were sooooo big that no one would have dared to ask for the needed time, in spite of being exactly the sort of lasting legacy that the telescope should leave behind?
In 2007, the Space Telescope Science Institute polled the community and asked for “white papers” describing possible big projects that Hubble should consider doing. Tons of great ideas flowed in, and based on that, it was decided that there would be a once in a lifetime call for “multi-cycle” proposals. The idea was to propose important projects that needed so much data that the observations couldn’t even be done in a single year (known as an observing “cycle”).
In other words, they wanted “awesome, but crazy”.
And we thought that mapping Andromeda fit that bill perfectly.
The Panchromatic Hubble Andromeda Treasury: While the Milky Way is a great place to study stars, it’s often a confusing place to work — you don’t know exactly how far away any given star is and there’s lots of dust to get in your way. Instead, if we look at Andromeda, we know all the stars are at nearly the same distance, and we have much less dust to block our view. The overall goal of the PHAT survey is therefore to map a huge fraction of the stars in the galaxy, and characterize them from ultraviolet (UV) to near-infrared (NIR) wavelengths. These stars, along with their ancestors and descendants (e.g., molecular clouds, HII regions, variable stars, X-ray binaries, supernova remnants, etc.), provide opportunities for enormous advances in the foundation on which all knowledge of the distant Universe is based. In other words, if you’re going to understand distant blobby galaxies, you’d better know all the details of the stuff that makes them up!
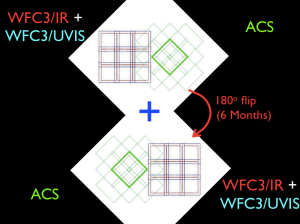
How the Survey Works: There are two keys to making the PHAT survey work. The first is to get lots and lots of Hubble time (Check!). The second is to find the single most efficient way to use that time, to get as many exposures at as many different wavelengths as possible. We do this by using two different cameras simultaneously. While one camera (Wide Field Camera 3: WFC3) is exposing, so is the Advanced Camera for Surveys (ACS), but pointing at a sightly different part of the sky. To map out large areas, we march the WFC3 camera around in a little 3×3 grid, while the ACS camera maps out an adjacent grid. Then, around six months later, we can rotate the telescope 180 degrees, and repeat the same exercise, but this time having WFC3 point to the area ACS covered previously, and vice versa.
Below, you can see a map of our current coverage, which shows a few regions where we only have the first half of the 3×6 “brick”. We should be getting the other halves of those bricks filled in during the coming months.

Why So Many Filters? Stars have a huge range in temperatures, from extremely cool (astronomically speaking) to ridiculously hot. Unfortunately, this leads to very large changes in where the stars emit their light. The hot stars can be booming in the UV, but faint in the NIR, whereas the cool stars are exactly the opposite. You therefore need a wide range of wavelengths to make sure you’re getting good detections of all kinds of stars. In addition, having a lot of filters allows us to do fancy things like solve for the exact amount of dust in front of a star, or to identify unusual objects like planetary nebulae. For cluster finding however, we only use the optical images (the two middle filters in the plot below) — these images are easy to make, and give plenty of information just on their own.

PHAT filters (top) compared to spectra of different types of stars (bottom)
What’s Next? As you can see from the map above, we still have some more observations to take (some of which are scheduled to take place next week!!!). If all goes well, we hope to have the last of our data in hand by the start of next fall (2013). As we finish up new large chunks of the survey, we’ll add more images to the Andromeda Project. So keep practicing, cluster hunters!

I can’t see the picture?
Again – this is a known issue (and very frustrating) and the team are working on fixing it. Thanks for letting us know and please keep an eye on this thread on Talk for updates: http://talk.andromedaproject.org/help/discussions/DAP1000a02
Hi,
I’m having problems loading the images – can’t continue to classify. Cannot continue to the next image – any advice?
This is a known issue and the team are working on fixing it. Thanks for letting us know and please keep an eye on this thread on Talk for updates: http://talk.andromedaproject.org/help/discussions/DAP1000a02
How will I know if I am doing this job correctly. What is a synthetic Cluster?
This should answer your questions! “First Week FAQs” http://blog.andromedaproject.org/2012/12/10/first-week-faqs/